ARM Forge is a one of the few Debugging and Performance profiling tools available on Shaheen. Developers can make use of these tools to find bugs in their code by live or offline debugging and also create performance profiles of parallel, sequential and even Python applications running on compute nodes of Shaheen.
Debugging with ARM Forge DDT
For interactive/live debugging, we encourage use of reverse connecting to Shaheen compute nodes. For this you will need to download an appropriate version of Remote client from ARM Forge and install it on your workstation/laptop. There is version alignment needed between ARM Forge installed on Shaheen and the remote client you install. At present the following versions are installed on Shaheen
> module avail arm-forge

-------------- /sw/xc40cle7/modulefiles --------------------
arm-forge/19.1.4 arm-forge/20.0.3 arm-forge/20.2.1
20.2.1 is default.
Firstly you need to instrument your source code for debugging by compiling it with -g flag enabled. Debuggers such as gdb, idb, TotalView or Arm Forge ddt require this instrumentation. Once you have (re) compiled the application, you can launch ddt as batch job as follows:
#/bin/bash
#SBATCH --ntasks=32
#SBATCH --time=01:00:00
#SBATCH --hint=nomultithread

# Load your software environment
module load arm-forge/20.2.1
ddt --connect
Once the job starts executing, you are ready to fire up your Remote client.
Configuring Remote client
To reverse connect to a ddt or map session running on Shaheen compute nodes, we first need to configure our remote client. This is a one-off configuration and will be remembered by your remote client application installed on your workstation/laptop.
Shaheen has 4 login nodes and 2 Gateway nodes. The cdl nodes (login nodes) 1 & 3 connect to gateway1 whereas cdl nodes 2&4 connect to gateway2. The following example demonstrates who to configure for even number of cdl nodes (you can maintain a separate configuration in your remote client for cdl nodes 1&3).
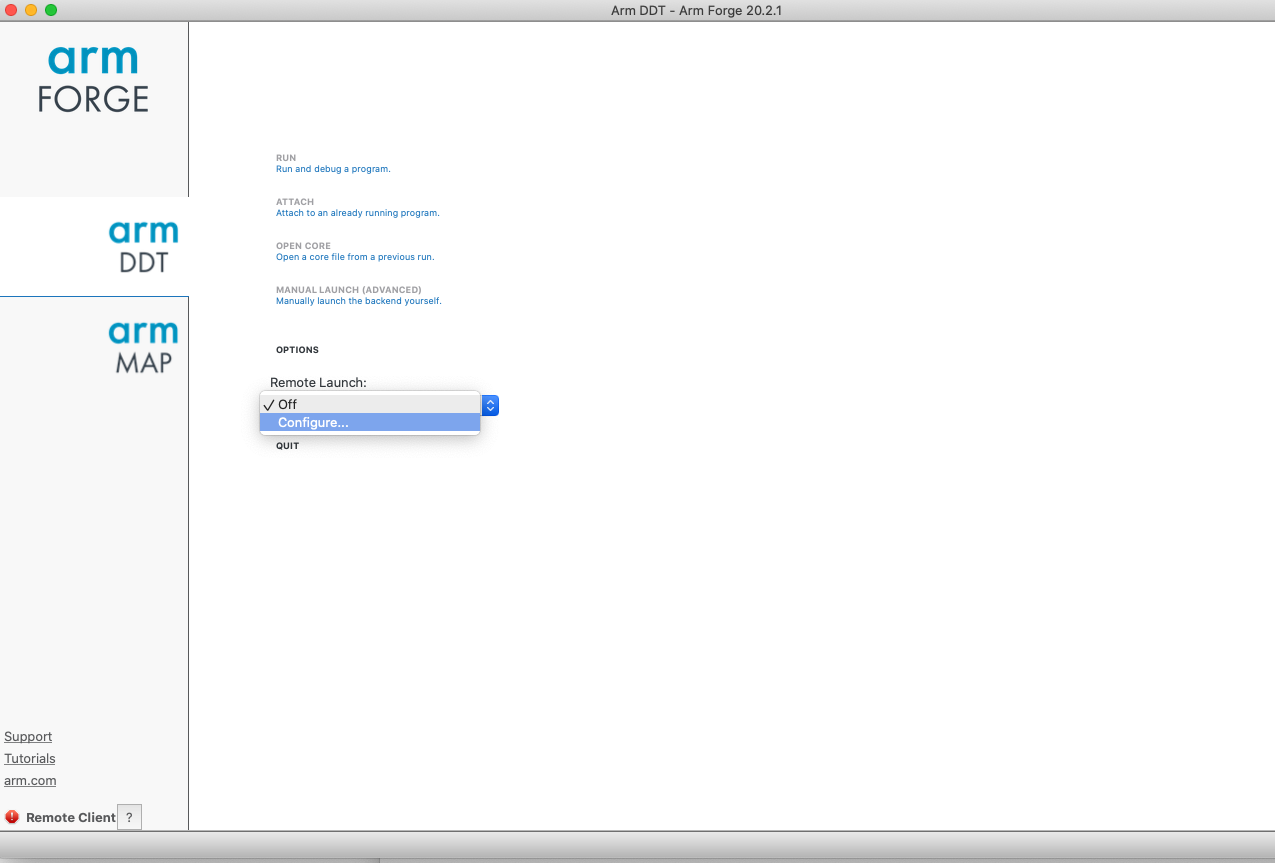
Select
Configurefrom Remote launch menu.